 |
| Methane hydrate in seafloor gravel. The ball-point pen shows size. (Photo credit: Thomas H. Mroz, Geological Survey of Canada. From: Kerr, 2004 [Gas Hydrate Resource: Smaller But Sooner]) |
METHANE AND METHANE HYDRATES, SECTION
2
On the margins of the continents, below the seafloor, methane
hydrate exists in vast quantities. It is there that the temperature
and pressure conditions for hydrate formation are found, and where
the hydrate, once formed, will not float away. These hydrates
exist at temperatures around 0°C (32°F) -- freezing --
and up to about 15°C (27°F) higher. The deep water of
the seafloor can be extremely frigid, down to almost two degrees
C° (3.6°F) below the freezing point of fresh water (Broecker,
1997). But the water of the deep sea does not freeze because of
the extreme pressure and its high salt content. (If it did, like
an ice cube in a cool summer drink, it would float to the surface.)
|
Nonetheless, the hydrates in the sediments of the seafloor do remain frozen: after all, they are icy lattices. In addition, they remain frozen even well above the normal melting point of ice (0°C; 32°F), and at temperatures up to about 15°C (59°F). They manage this feat because of the enormous pressure that exists at these depths. The pressure is due to the weight of the overlying water. This weight accumulates so rapidly that just 10 meters (yards) below sea level, the pressure from the water alone is equivalent to that of the atmosphere. Every additional 10 meters adds another equal amount of weight. |
These great pressures keep hydrate stable even at the increasingly warmer temperatures found in the more deeply buried sediment. Sediment temperatures increase with depth because they are heated from below, by the warmth from the interior of the Earth. Typically temperature increases with sediment depth by about 40°C to 50°C per kilometer (about 115°F to 145°F per mile). (This increase is considerably higher than that in the crust of continents, which is about 25°C per kilometer, or 72°F per mile.) This temperature rise is referred to as the geothermal gradient -- or geotherm -- for short.
Eventually the increasing warmth in deeper sediments prevents the formation of hydrates. Below a certain depth, depending on the local temperature conditions, hydrates cannot form, and only free methane exists. Between this depth, known as the base of the gas hydrate stability zone (BGHSZ) and the top of the gas hydrate stability zone is where the hydrates are. Thus oceanic methane hydrates are usually found buried in sediments where the overlying seawater is at least 300 meters (yards) deep. Depending on the local geothermal gradient, the hydrates can be found up to about 2000 meters (about 1.2 miles) beneath the seafloor, though typically the depth extends to only about 1100 meters (somewhat more than 0.6 mile) below the seafloor.
 |
Methane Hydrate Stability Curve. In this example, the zone in which gas hydrate can exist is between 1200 and 1500 meters. (Actually, methane hydrates can exist anywhere from about 300 to 200 meters, depending on temperature conditions and sediment depth.) To explain the various lines: The "phase boundary" line (a pressure/temperature line) divides the methane as hydrate (that is methane ice) to the left of the line from methane that has dissociated from hydrate on the right. The "hydrothermal gradient" dotted line indicates the water temperature. The "Water/ Sediment" line marks the seafloor. The "geothermal gradient" dotted line indicates the temperature of the sediments, which increases with depth. At some depth (marked by the line "Base of gas hydrate"), the sediments become too warm for hydrate to exist. Below this depth, free ethane can exist, but not methane in ice. Methane hydrate, therefore, can only exist in the speckled area. (Kvenvolden, 1993) |
To study the ocean floor and the sediments below, scientists often use seismic reflection (sonar). Oceanographic ships bounce sound waves (often big pops from air guns) off ocean bottoms, and the echoes tell the distance to the bottom, just as the echoes of shouts in canyons, if carefully measured, can indicate the distance to the canyon walls. The echoes of those sound waves reflected from the ocean bottom can also indicate the nature of the surface under the waves. Rock reflects sound strongly; waterlogged sediments reflect it only weakly. But the lack of strong reflections from the sediments below the seafloor permit the sound waves to penetrate more deeply, helping to provide details of deeply buried structures. Thus these seismic reflection studies can provide a lot of information about parts of the planet which are otherwise difficult -- if not impossible -- to explore directly.
One strange feature turned up in many early oceanic seismic reflection studies. This reflection had been the cause of some consternation on the part of those who explored the ocean floor of the continental margin for oil deposits because the reflection seemed to indicate that there was a "sub-floor" some distance beneath the actual floor of the ocean. The "sub-floor" reflection paralleled the seafloor, undulating up and down pretty much in synchrony with the seafloor itself. Because of this curious behavior, this false bottom reflection was given the name "bottom-simulating reflector," or BSR.
 |
|
Sonar image of seafloor sediments. Vertical distance is measured in "two-way travel time in seconds," because sonar imaging measures sound reflections. Typically, however, each second of time, within the sediment, represents slightly over a kilometer (0.6 mile) in distance. Thus the vertical distance shown here is somewhat over two kilometers. (Note that the horizontal distance is NOT to the same scale.) The image shows the BSR, the bottom-simulating reflector. Notice how it closely parallels the contour of the seafloor surface, thus giving it its name. Methane hydrate (here referred to as gas hydrate) is found in the sediment above the BSR, and free gas in the sediment below. It is the contrast in densities between the overlying, solid hydrate and the free gas in the sediment below that causes the change in the sonar reflection. (Kvenvolden, 1994) |
The mystery was solved, however, when the BSR was traced to the existence of the free methane/methane hydrate interface (boundary). The free methane gas failed to reflect the sonar signal, while the layers of methane hydrate above created a strong signal, made even stronger by the contrast with the free gas below. The BSR marked this boundary. The BSR closely followed the topography of the seafloor because it was to this depth that the oceanic cold penetrated, allowing the formation of hydrate. Deeper, the warmth from the interior of the planet did not permit the hydrate to form.
Now that scientists recognize the existence and understand the meaning of the BSR, they use it as a primary method to determine the locations of methane hydrate on continental margins throughout the world. The BSR delineates the base of the gas hydrate stability zone (BGHSZ), and allows its determination without drilling.
Within the gas hydrate stability zone, methane hydrates typically appear as bright white streaks, lumps, lens-shaped units and discontinuous layers in the brownish continental margin muds. Recent laboratory work has indicated that methane hydrate may also exist in thin sheets in layers of certain ocean bottom clays (specifically, the clays montmorillonite and smectite). Therefore, even where methane hydrate is not visibly present, it may be concealed as part of seafloor muds (Guggenheim and Koster van Groos, 2003).
In coarse-grained sediment units -- those composed of sands and gravels rather than muds -- there is greater pore space for hydrates to form. In these units, therefore, hydrates can be found as cements -- gluing the sands and gravels together by occupying the spaces between grains and pebbles. There are also more massive, laterally continuous layers, ranging from two meters (yards) up to several tens of meters in thickness (Clennel, 2000). These hydrate layers and units, thick and thin, form a largely impermeable barrier within the sediment.
Below this barrier, however, lies a substantial amount of free methane, too warm to form hydrate. Some of this free gas undoubtedly trickles upward into the gas hydrate stability zone (GHSZ), but there, because pressure and temperature conditions are right, it also becomes hydrate. Most hydrate, in fact, is likely to have been produced in this fashion. Some free methane, however, is carried upwards in warm fluids (water with dissolved gases, minerals, and/or organic matter) that circulate in the sediments. This methane may make it through the gas hydrate stability zone and the overlying sediments, evade being consumed by methanotrophs, and escape into the water column and eventually into the atmosphere.
Known localities of seafloor and permafrost methane hydrates. To a large extent, this map only reflects where drilling has occurred, and should not be taken as an indication of the true distribution of the hydrates. Further drilling will undoubtedly reveal more hydrate.
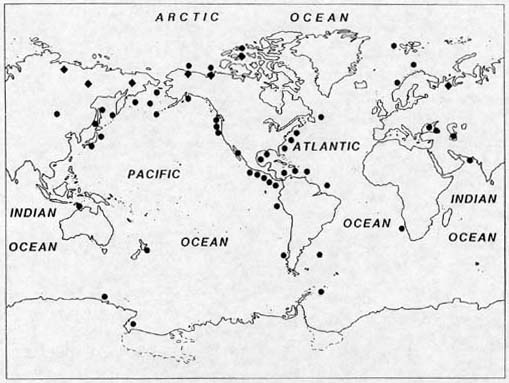
Numerous attempts have been made to estimate
the amount of methane hydrate in the world's continental margins.
The task is a difficult one, partly due to the relative scarcity
of drill cores into and through the hydrates themselves. Consequently,
all quantity estimates must be based on limited data, and on factors
such as the amount of pore space available for hydrate storage
which also must be estimated. Nonetheless, a recent study that
meticulously identified these various factors and determined their
probable ranges came up with a global estimate of 5,000 to 20,000
gigatons (billions of metric tons, abbreviated as Gt) of carbon
in oceanic hydrate methane (Dickens, 2001). This seems like a
not unreasonable estimate not merely because of the careful work
that went into making it, but also because it is in substantial
agreement with other estimates using a variety of methods (as
Kvenvolden, 1988a, which estimates 10,000 Gt), as well as the
fact that the estimate range is quite generous. A new estimate,
based on the amount of carbon reaching the seafloor, places methane
hydrate at 3000 Gt (Buffett and Archer, 2004). (Map modified from
Kvenvolden, 1988)
The methane hydrate study does not attempt
to estimate the amount of free methane that underlies the hydrate,
but another study indicates that this may range from one-sixth
to two-thirds of that in the hydrate itself. The maximum likely
quantity of free methane is about 1550 Gt, the minimum about 150,
with an intermediate estimate of 520 (Hornbach, 2004). This is
a substantial amount of methane; nonetheless, it does not appreciably
increase the total amount of methane (hydrate plus free gas) found
in the continental margins. A new estimate, however, puts the
amount of free gas at about 38% of total continental margin methane
(Buffett and Archer, 2004).
Methane hydrate itself is also found in permafrost. During the Ice Age, the cold near the poles was so intense that the ground froze. Interestingly, the great ice sheets that descended from the north into North America, Scandinavia, and western Russia provided some protection from the cold, and spared large portions of those regions from the permanent freezing of their soils. What freezing did take place largely melted at the end of the Ice Age.
Ground that was not covered by ice, however, was not so fortunate. In frigid areas that lacked sufficient precipitation (in the form of snow) to create the ice sheets, like a good portion of northern Siberian Russia and elsewhere in the Arctic, the ground froze down to depths as great as 1000 meters (three thousand feet), though about 600 meters (roughly 1800 feet) is more typical. Although the surface layer of this region does melt during the brief far northern summer, it is still frozen at shallow depths. Hence the name permafrost for permanently frozen ground.
Technically, permafrost is ground that remains below freezing for at least two years in a row, but much permafrost has been around for far longer than that. Perhaps astonishingly, permafrost underlies as much as 20% of the earth's continental surface: in polar and near polar regions, and in mountainous areas.
 |
| North polar region continental permafrost distribution. The darker blue indicates the area of continuous permafrost; the lighter blue the discontinuous permafrost, where occasional thawing has taken place. (Graphic adapted from Arctic Monitoring and Assessment Programme/CAFF, from Stokstad, 2004.) |
It is also found in the continental margins that enclose the Arctic Ocean, which froze as deeply as the surrounding continents. Because permafrost usually extends to depths of about 600 meters and the hydrate stability zone extends deeper still, methane hydrate can be found both within the permafrost and below it. The stability zone for methane hydrate in permafrost therefore is usually between about 200 and 600 meters (yards), but it can be found at depths as shallow as about 130 meters, or as deep as 2000 (1.2 miles: Kvenvolden, 1988b).
There are considerable quantities of
methane hydrate found in permafrost. One estimate puts the total
at about 10 Gt of methane (Kvenvolden, 1993), although there is
wild disagreement in such estimates (Kvenvolden, 1988b). This
total represents only about 1% of the amount in the ocean's continental
margins. Nonetheless, permafrost hydrate methane may have been
important in warming the planet at the end of the most recent
ice age.
Estimated size of hydrate-related
methane reservoirs
Each methane molecule is three-quarters (3/4) carbon, by atomic
weight.
| Amount of methane | Amount of carbon | |
| Continental margin methane hydrates | 6667 to 26667 Gt | 5000 to 20,000 Gt |
| Free gas below continental margin hydrates | 1550 Gt (high estimate) 520 Gt (intermediate) 150 Gt (low estimate) |
1163 Gt 390 Gt 113 Gt |
| Methane hydrates in permafrost |
10 Gt | 7.5 Gt |
| Total (rounded) | 6800 to 28000 Gt | 5100 to 21000 Gt |
Gt = 10^15 grams = one billion metric
tons (each metric ton = 1.1 imperial tons)
In measuring the amount of methane in hydrates and in the free gas below them, its carbon content is often included as well. Employing an estimate of the amount of carbon, rather than an estimate of the methane itself, allows comparison with carbon elsewhere on the planet. Carbon is found in things living and dead, terrestrial and marine, in the air, water, and rocks. These stores of carbon are referred to as carbon reservoirs, which hold carbon just as a water reservoir holds water.
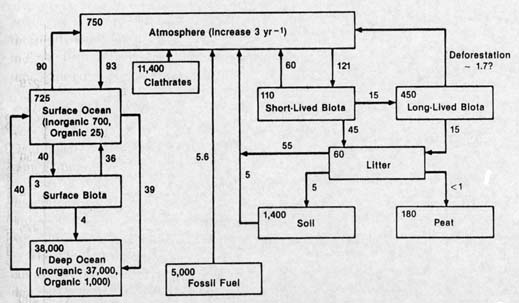
As with water reservoirs, carbon can move from one reservoir to another. A simple example is that of what happens in forest fires: some carbon moves from the reservoir of living terrestrial organisms to that of the atmospheric reservoir in the form of carbon dioxide and carbon monoxide gas. Another example is that of leaves in autumn: the falling leaves move from the reservoir of living terrestrial flora to that of dead terrestrial organisms. Consumed by beetles and earthworms, some of that carbon enters yet another reservoir, that of terrestrial fauna.
These reservoirs may be considered separately or considered together, for differing scientific purposes. Thus all terrestrial organisms may be considered together, as the terrestrial biota reservoir, or that reservoir may be subdivided, for example, into flora (plants), fauna (animals), and microorganisms. Carbon is frequently moving between one reservoir and another, as when a leaf is consumed by a caterpillar. There the carbon moves from the reservoir of terrestrial flora to that of terrestrial fauna. When the caterpillar breathes out carbon dioxide, the exhaled carbon becomes part of the atmospheric reservoir. But perhaps only temporarily, if the carbon dioxide is taken up by a plant during photosynthesis, and used for making more leaves.
In these processes, carbon is being exchanged
from one reservoir to another. Carbon in some reservoirs is more
easily exchanged than carbon in others. The previous example illustrates
a common sort of exchange. The carbon in the crust of the Earth,
however, largely in the form of carbonate rocks like limestone,
is not easily exchanged. Nor was the carbon that was locked up
in fossil fuels -- petroleum, coal, and natural gas -- until the
coming of the industrial age. Now, carbon from the fossil fuel
reservoir, as that carbon is burned, is entering the atmospheric
reservoir (largely as carbon dioxide) at a colossal and increasing
rate.
Another look at the diagram of carbon reservoirs reveals some astonishing facts about the methane hydrate reservoir. It is at least twice that of the fossil fuel reservoir, that is, there is more carbon in methane hydrate than in oil, coal, and natural gas. It is greater than that of all other near-surface carbon reservoirs (except carbonate rocks) combined. It is vastly greater than the amount in all organisms, living and dead. And -- not least -- it is over thirteen times the total amount of carbon in the atmospheric reservoir.
The quantity of carbon in the methane hydrate reservoir has attracted considerable interest on the part of energy companies, particularly as petroleum reserves are depleted. Extracting methane from hydrate has thus far proved to be prohibitively expensive. Dispersed within sediments or permafrost, methane can only be released by pumping warm fluids into the hydrate, or by adding chemicals which cause its dissociation (the breakup of hydrate into water and its enclosed gas, usually methane). The Soviets experimented with the latter strategy in the Messoyakha field in western Siberia beginning in the late 1960s, pumping methanol (methyl alcohol) down into the hydrate. Though some methane was obtained, the venture proved a costly failure, and after many years the attempt was abandoned (Kvenvolden, 1988b).
This failure does not rule out the possibility that other technologies will ultimately be successful, but it does emphasize the fact that extracting methane from hydrate is likely to be complex and expensive -- perhaps prohibitively so. Employing two completely different extraction technologies, a test well in the Mackenzie delta of Canada's Arctic northwest in 2003 (the Mallik project) succeeded in dissociating methane hydrate. One technique was simply to depressurize the hydrate by drilling through it to the free gas trapped beneath, thereby relieving the pressure on the hydrate from below, allowing both free gas and dissociating methane to flow up the well pipes. The second was to pump warm water into the hydrates, dissociating them by warmth, and carrying methane to the surface in the recirculating water (Kerr, 2004).
Though the Mallik project showed that
such techniques can release methane from hydrate, the economic
feasibility of large-scale extraction nonetheless remains doubtful.
While drilling through hydrate to the free methane below may offer
an opportunity for exploiting this resource, that methane must
pass through the hydrate stability zone, which could cause difficulties.
The obstructive formation of hydrate in pipelines has been a well-known
and persistent problem for energy companies. The Mallik well site
was specifically chosen because approximately half of the more
than two hundred meters of sediment at depths from about 900 to
1100 meters was full of hydrate; few other locations possess such
high concentrations of hydrate. Even the optimists think that
any commercial production of methane from hydrate is 10 to 15
years away, and any significant production at least 30 years in
the future (Kerr, 2004).
While methane hydrate is quite widespread, its formation does require specific pressure and temperature conditions. Changes in these conditions, therefore, can lead to the dissociation of the hydrate and the release of the enclosed methane. The hydrate reservoir undoubtedly varies in quantity over time as methane is produced by decomposition, or released into the overlying sediments. However, significant releases of hydrate methane, and the free methane that normally underlies it, can be caused by changes in temperature and pressure conditions.
Some free methane, as earlier mentioned, certainly escapes into and through the gas hydrate stability zone via warm fluids circulating in fault zones. The general heating of the hydrate, as by changing ocean currents, or at the end of ice ages, can release much larger quantities, and more rapidly. The temperature changes do not have to be great: a few degrees warming will do. Pressure changes also effect the release of methane. When large quantities of water are removed from the ocean as they are in ice age continental ice sheets, sea level is lowered, and continental margin hydrates are depressurized. Conversely, when sea level rises, the ocean can flood coastal areas underlain by permafrost, thawing them and releasing hydrate methane.
The most vulnerable hydrates are probably those associated with offshore Arctic permafrost (Kvenvolden, 1988b). These hydrates lie at relatively shallow depths, and are located where the ice age permafrost is currently still melting. In addition, because global warming has hit polar regions first and hardest, they are particularly vulnerable to the effects of that warming.
The Alaskan North Slope, and the adjacent Beaufort Sea, a part of the Arctic Ocean, have been intensely studied because of the area's great oil wealth. Numerous drilling sites in the Alaskan North Slope permafrost have already recorded significant surface warming -- of 2 to 4°C (3.6 to 7.2°F) -- during the twentieth century (Lachenbruch and Marshall, 1986). The Beaufort Sea, an area of widespread offshore permafrost, is presumably subject to the same warming as the onshore permafrost. This oceanic area turns out to be a zone of "massive slumps and slides," associated with gas hydrates (Kvenvolden, 1993).
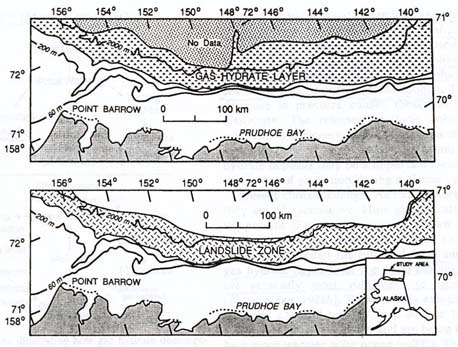 |
| Maps of the Beaufort Sea. Upper map is of the methane hydrate (here, gas hydrate) zone in the Arctic Ocean north of Alaska's North Slope. Lower map shows the area of submarine landslides. Note how the landslide area is essentially the same as that of the gas hydrates, thus revealing the relation between gas hydrates and seafloor stability. Oceanic warming (between ice ages) or depressurization (during ice ages) can cause the dissociation of the hydrates, leading to the submarine landslides. (Kvenvolden, 1993) |
When methane hydrate dissociates (melts and releases its gas), the sediment is no longer held together by the hydrate ice, and the melt water provides a slippery surface on which the overlying sediments can slide. The Beaufort Sea slumps and slides are presumably due to such hydrate-related sediment disturbances during ice age drops in sea level, and/or warmth after each cooling episode.
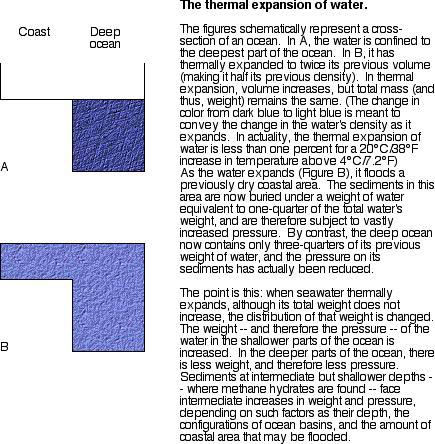
On other continental margins, however,
it has been suggested that the effects of warming would be counterbalanced
by the increased pressure due to the thermal expansion of water
(for example, Kvenvolden, 1993; Dickens, 2001). Above 3.9°C
(39°F), water expands as it warms. This expansion increases
the volume of the water, but not its weight, which remains the
same. But because an increase in the ocean's volume adds proportionally
more water to the ocean's shallower areas, the pressure on the
continental margin sediments is also proportionately increased.
The thermal expansion of water
To visualize how this
works, suppose the thermal expansion of the ocean produces an
increase of ten meters (yards) in global sea level. In places
where the ocean is six kilometers (about 3.5 miles) deep, such
a small increase hardly matters. But in areas where the ocean
is just ten meters deep, another ten meters doubles the depth
of the water. The resulting increase in pressure on the shallow
seafloor sediments is almost double. (A second example is provided
in the graphic below.)
The idea that the effect of oceanic warming on continental margin hydrates may be counterbalanced by pressure increases, however, may not hold up to more detailed scrutiny. This is because below 3.9°C (39°F), water, unlike other cooling liquids, does not contract, it expands. Water at its freezing point, 0°C (32°F) is actually less dense than slightly warmer water. Thus frigid water, warming from freezing to 3.9°C, actually contracts.
The contraction of water as it warms to 3.9°C, and its expansion thereafter, thus means that there can be no simple and general description of how seafloor sediments and their hydrates will respond to warming. That behavior depends on the specific characteristics of particular ocean areas, including how deep they are, how temperatures change with depth (the "temperature profile"), and how that profile changes with warming. With ocean bottom water temperature often hovering at close to 0°C, surface waters in polar regions not much higher, but tropical surface waters up to about 35°C (95°F), there can be enormous variation in temperature profiles between one oceanic area and another. Additional factors, including variabilities due to seasonal warming and cooling cycles and seasonal current changes, complicate things even further.
The simple presumption that warmed hydrates
in sediment will stay intact because of the increased pressure
of overlying water therefore does not seem adequate to describe
what, upon closer examination, appears to be a highly complex
matter. A further complicating factor is that global warming not
only increases the volume of water by decreasing its density (above
3.9°C/39°F, that is); it also actually adds to the total
mass of water in the oceans by the melting of glaciers and the
Greenland and Antarctic ice sheets. Though the rate of the rise
in global sea level in the twentieth century has been minute (a
mere 1.5 to 2.0 millimeters, or well under a tenth of an inch,
per year), most of that increase is not due to the thermal expansion
of water (only about 0.5 millimeters may be), but is rather the
result of melting (Miller and Douglas, 2004).
CONTINUE TO NEXT
SECTION (Methane, methane hydrates, and global climate)